
PSQS: Beyond the annual survey
Most practitioners recognise that there is at least a correlation between service quality and customer opinion of the service in question. To refine this slightly, the correlation is between service quality and customers' perceptions of service quality - as mediated by their expectations - which tends then to be demarcated by their levels of satisfaction. The PSQS itself works along these lines.
Clearly, if we accept this correlation, then recording and analysing customer opinions - perhaps, but not necessarily, in terms of their satisfaction - can shed light on the quality of the service.
The PSQS is a marvellous - almost the only - strategic means of gathering, analysing and benchmarking this information in the HE sector. Its results can inform and guide university leaders in how they can learn from, improve and even resource their professional services. One year later, they can revisit the data and determine whether their actions have had an effect.
Now, what if there was a tool - a simple, basic device - that could be employed to illuminate services' trajectories between times as well as provide a tactical means to improve or learn from them?
Read on.
Tactical and Strategic Intelligence
Lets not go too deep, but in a nutshell strategic planning is for the long term, using a range of data to guide the organisation through its future possibilities, available choices and probable outcomes. In PSQS terms, if - for example - a new government were to prosecute an international education strategy, those professional services contributing most to its delivery might find themselves in the limelight, and maybe if they were performing less than 'optimally'... well, you probably get the gist.
So, you put your resources on the line and you expect results. Soon you'll need to know: Are these services performing? Are your overseas students content? Is your international outreach reaching out?
Would your partners and students endorse you?
Having set the strategy an organisation must gauge and guide its operations to contribute to the strategic intent. That's tactics.
You know where your professional services have got to go. You need to find out if they're getting there. You can't do this by running the PSQS every couple of months. You need something much lighter on its feet.
Welcome to the Net Promoter Score.
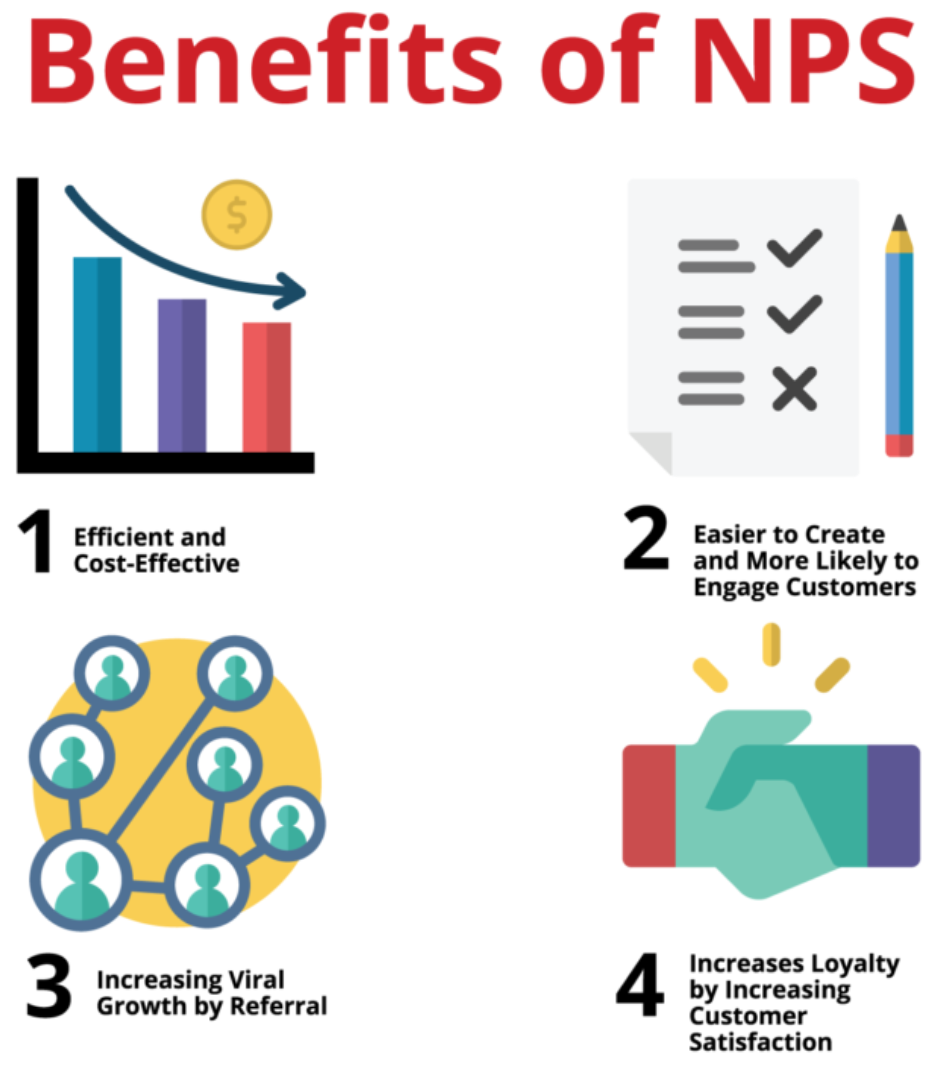
How the Net Promoter Score (NPS) can contribute
Firstly, a caveat: NPS isn't for everyone. Statisticians have argued that it oversimplifies the enquiry, and that the data does not accurately predict customer approval. Others argue that it is a mistake to presume that a commercial tool - regardless of whether you approve of it, or not, in that context - is ill-suited to other mileaux. Fair enough.
It is, however, possible to set aside these objections if we take it for what it is: a single, simple, high volume metric that can show trajectory.
As a user of PSQS you will have examined and established the relative performance of your professional services, both internally and against their benchmarks. You will have put in place the means to transfer best practice, if that's appropriate, or to otherwise stimulate performance where required. But, as mentioned above, how can you track progress?
It's at this point that we would cautiously recommend the value of NPS. It's calculational and operational simplicity means that you can easily deploy it across your estate. Monthly, weekly, even daily you will be able to compute the actual score (the 'S" in NPS) and determine how your units are getting on. It has a second string to it's bow as well: everyone who takes the action of responding, in situ, to their service experience also has the option to provide verbatim commentary qualifying their response. This is research gold-dust: an instant, visceral response to the service in question.
So, how does it work?
NPS: The process
A single question
Everybody who interacts with a service is invited to answer one straightforward question. In the PSQS context it might be this (though it can be modified as needed):
"How likely are you to recommend this service to a colleague or fellow practitioner?"
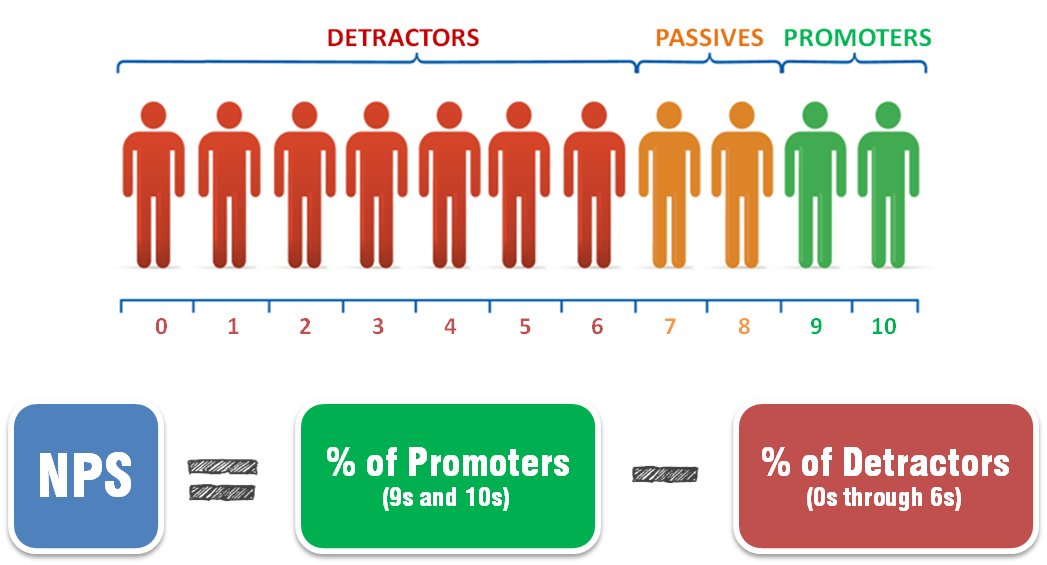
The respondent is offered a scale from '0' (not at all likely) to '10' (extremely likely) - an 11 point scale. Each respondent is then catgorised according to their selection:
- Those who select 0 to 6 are considered to be negative respondents, or "detractors"
- Those who select 7 and 8 are considered "passive" respondents, and their input is discounted
- Those who select 9 and 10 are considered positive respondents, or "promoters"
- The NPS is calculated by subtracting the percentage of detractors from the percentage of promoters. Passives are ignored for the calculation.
How to ensure that you get a reponse.
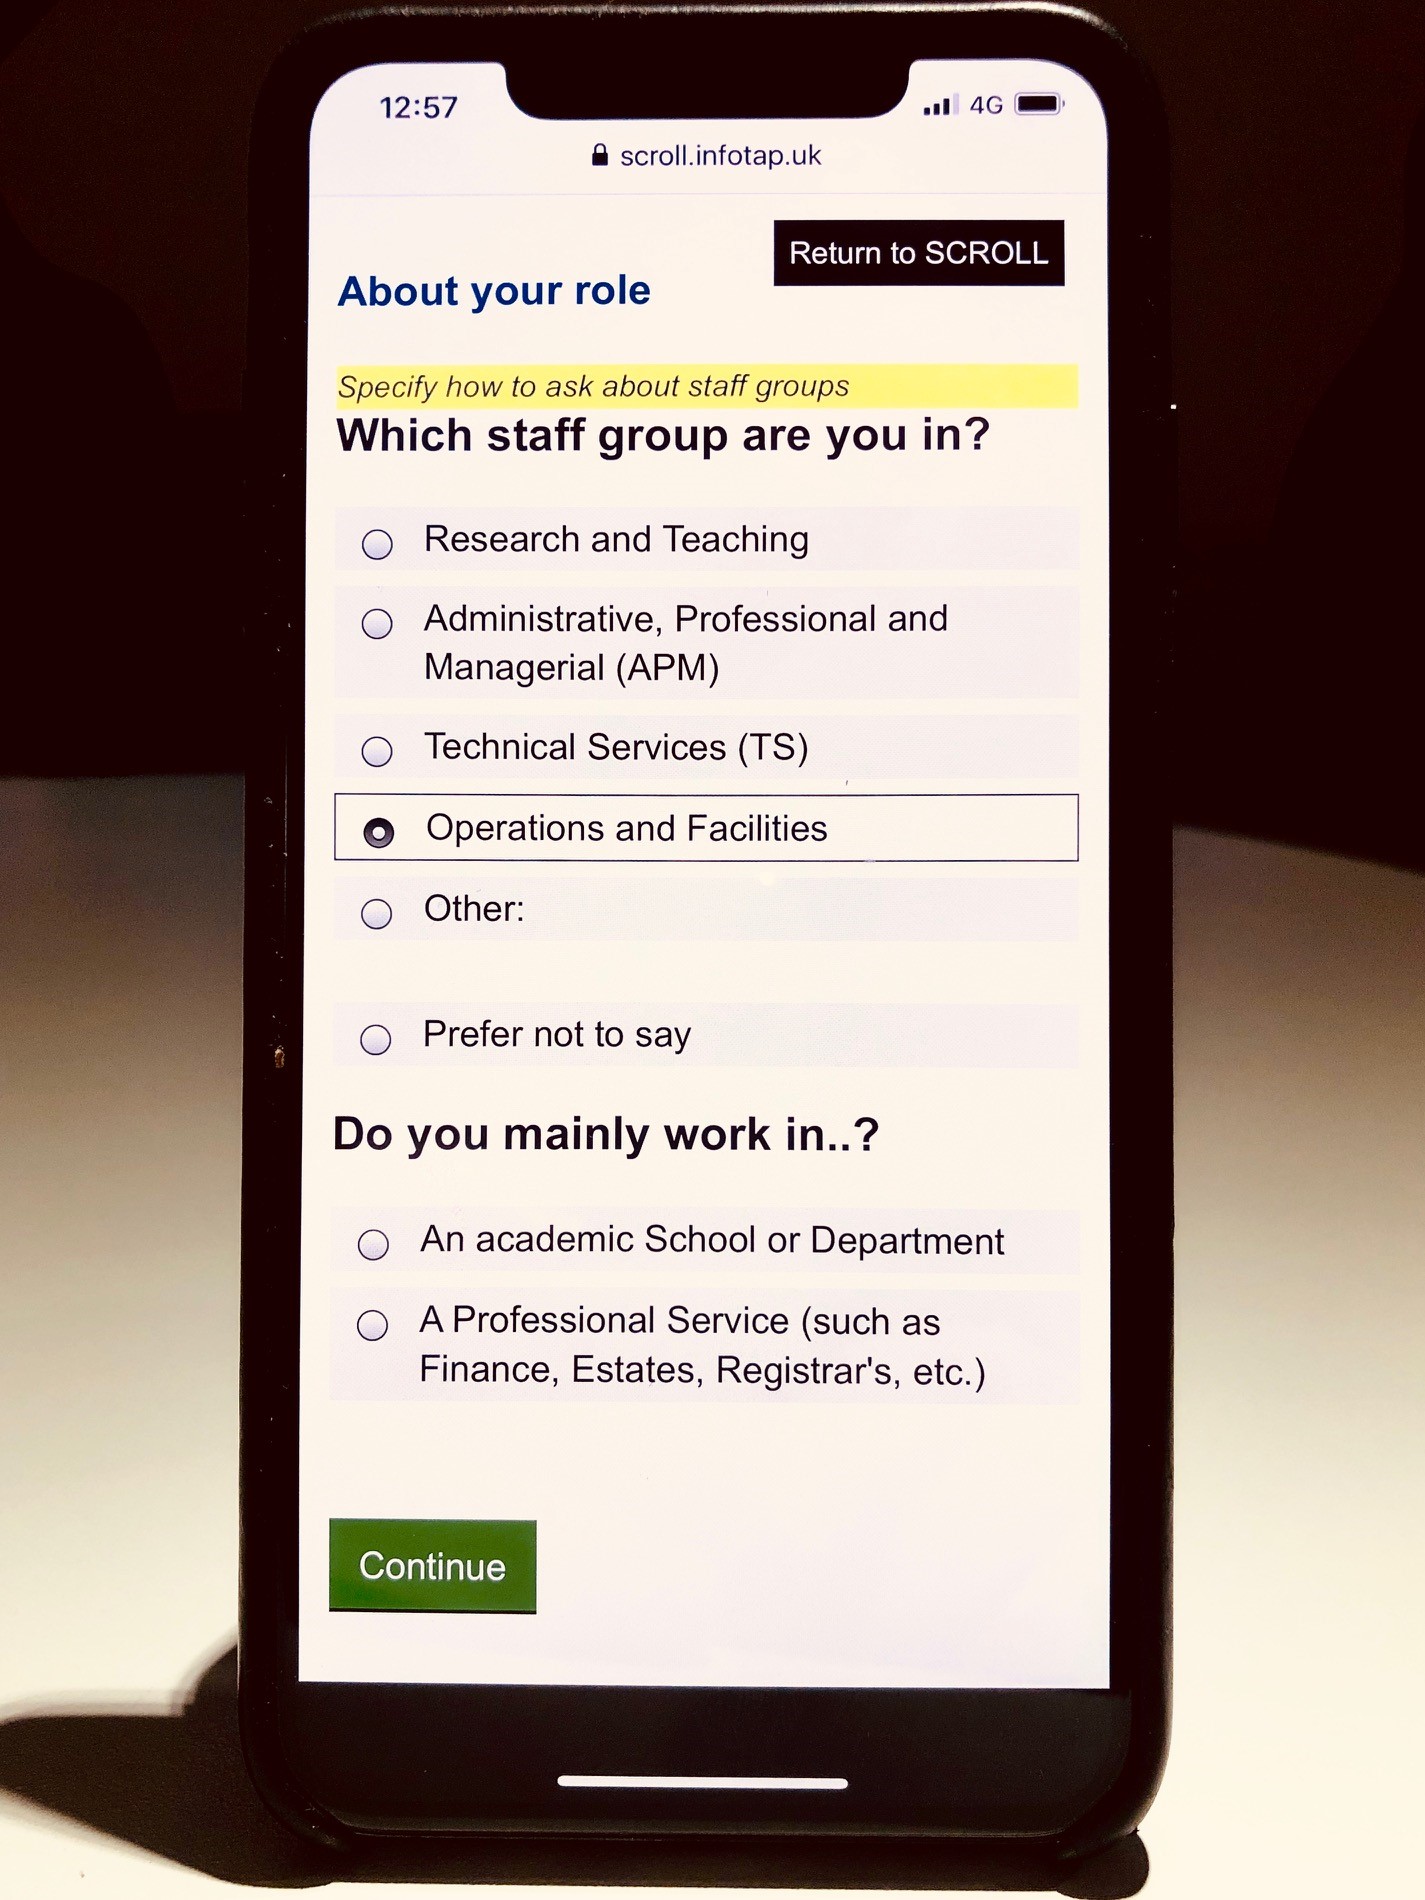
- You could provide a terminal for it (in a library, for instance)
- You could email the subject with a URL for them to respond later
- Perhaps the best way is to ask them to point their smartphone at a handy QR code so that the response is garnered there and then. NPS software often provides this facility.
The results
After surveying your service users for a given period, let's say you have the following distribution:
- Detractors - 20%
- Passives - 30%
- Promoters - 50%
To calculate your NPS, you simply subtract 20% from 50% and drop the percent to end up with an integer. Here, that results is an NPS of 30.
To pick up the earlier point - let's not put to much weight on the number! The point is to maintain or improve it, depending on the findings from the PSQS.
If, during the course of the ongoing survey, you have collected verbatims it may be well-worth doing the textual analysis to see what's going right - or wrong!
NPS: An offer from SDA
During 2022, every university participating in PSQS will have six months free access to SDA's forthcoming NPS app. We think it will provide an invaluable means to 'top up' the results gleaned from the PSQS and allow administrators to make important tactical corrections as well as to identify areas of outstanding performance from which other services might be able to learn.
Check back soon for more developments.

Testimonials
“...SDA's fully managed service enabled all of (our) service requirements to be seamlessly integrated into the delivery plan...each delivered to time and cost.”

Civil Contingencies Secretariat, Cabinet Office
“We like working with (them) because we know that the team will really get into the details of our project, read it carefully, give us good advice and script it perfectly.”

Ipsos MediaCT
“I realise that our needs were very demanding at times, but you and your colleagues responded magnificently with a high degree of professionalism and technical ability.”
Jon Thompson, Director General of Corporate Services Directorate, DCSF
“All services have been major high-profile initiatives for Ofsted, which have delivered core business services in areas where timeliness, accuracy and responsiveness have been paramount.”
Anthony Boucher, Chief Statistician, Ofsted